Data Menu
-
Country Pages
-
Asia & the Pacific
- Afghanistan
- Bangladesh
- Bhutan
- Cambodia
- China
- India
- Indonesia
- Iran, Islamic Republic of
- Lao People's Democratic Republic
- Malaysia
- Maldives
- Mongolia
- Myanmar
- Nepal
- Pakistan
- Papua New Guinea
- Philippines
- Sri Lanka
- Thailand
- Timor-Leste
- Viet Nam
-
Eastern Europe & Central Asia
- Albania
- Armenia
- Azerbaijan
- Belarus
- Bosnia and Herzegovina
- Georgia
- Kazakhstan
- Kosovo Office
- Kyrgyzstan
- Moldova, Republic of
- North Macedonia
- Serbia
- Tajikistan
- Türkiye
- Turkmenistan
- Ukraine
- Uzbekistan
-
Arab States
- Algeria
- Djibouti
- Egypt
- Iraq
- Jordan
- Lebanon
- Libya
- Morocco
- Oman
- Palestine
- Somalia
- Sudan
- Syrian Arab Republic
- Tunisia
- Yemen
-
East & Southern Africa
- Angola
- Botswana
- Burundi
- Comoros
- Congo, the Democratic Republic of the
- Eritrea
- Eswatini
- Ethiopia
- Kenya
- Lesotho
- Madagascar
- Malawi
- Mauritius
- Mozambique
- Namibia
- Rwanda
- Seychelles
- South Africa
- South Sudan
- Tanzania, United Republic of
- Uganda
- Zambia
- Zimbabwe
-
Latin America & the Caribbean
- Argentina
- Bolivia, Plurinational State of
- Brazil
- Chile
- Colombia
- Costa Rica
- Cuba
- Dominican Republic
- Ecuador
- El Salvador
- Guatemala
- Haiti
- Honduras
- Mexico
- Nicaragua
- Panama
- Paraguay
- Peru
- Uruguay
- Venezuela, Bolivarian Republic of
- Caribbean (multi-country)
-
West & Central Africa
- Benin
- Burkina Faso
- Cabo Verde
- Cameroon
- Central African Republic
- Chad
- Congo
- Côte d'Ivoire
- Equatorial Guinea
- Gabon
- Gambia
- Ghana
- Guinea
- Guinea-Bissau
- Liberia
- Mali
- Mauritania
- Niger
- Nigeria
- Sao Tome and Principe
- Senegal
- Sierra Leone
- Togo
-
Country Menu
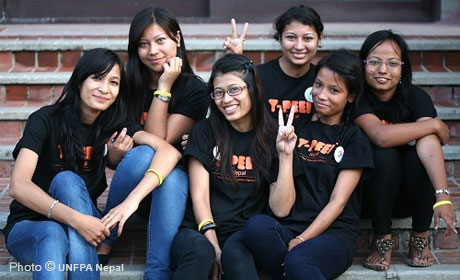
UNFPA Nepal
Active in Nepal since 1971, UNFPA has supported the health-sector programme, enhanced the national response to gender-based violence, and implemented the population and housing census. Today, programmes support the subnational capacity for planning and managing population, gender and reproductive health programmes, and strategies in districts that have made slow progress in achieving the goals of the International Conference on Population and Development (ICPD).
Data overview
View more
Population
Population, by age group, per cent
 Population aged 0-14
 Population aged 15-64
 Population aged 65+
Sexual and reproductive health
Births attended by skilled health personnel, per cent, 2014-2019
 Births attended by skilled health personnel
Family Planning
Proportion of demand satisfied with modern methods, women aged 15-49, per cent, 2022
 Modern method
Education
Total net enrolment rate, percent
Gender, Rights, and Human Capital
Decision making on sexual and reproductive health and reproductive rights, percent, 2007-2022:
63
Adolescent birth rate per 1,000 girls aged 15-19, 2024:
71
Intimate partner violence, past 12 months, percent, 2018:
11
Decision making on women's own health care, percent, 2007-2022:
72
Decision making on contraceptive use, percent, 2007-2022:
91
Decision making on sexual intercourse, percent, 2007-2022:
91
Harmful Practices
Child marriage by age 18, percent, 2023:
35
Female genital mutilation prevalence among girls aged 15-19, percent, 2022:
-
Demographic Dividend: Nepal
View more
Population Pyramid
Year: 1950
females
males
Population in thousands
Life Expectancy
Life expectancy is 33
Life expectancy is 34
Life expectancy is 36
Life expectancy is 38
Life expectancy is 41
Life expectancy is 44
Life expectancy is 47
Life expectancy is 51
Life expectancy is 55
Life expectancy is 59
Life expectancy is 62
Life expectancy is 65
Life expectancy is 67
Life expectancy is 69
Life expectancy is 70
Life expectancy is 71
Life expectancy is 72
Life expectancy is 73
Life expectancy is 74
Life expectancy is 75
Life expectancy is 76
Life expectancy is 77
Life expectancy is 78
Life expectancy is 78
Life expectancy is 79
Life expectancy is 80
Life expectancy is 81
Life expectancy is 82
Life expectancy is 83
Life expectancy is 84
Life expectancy is 34
Life expectancy is 34
Life expectancy is 36
Life expectancy is 39
Life expectancy is 42
Life expectancy is 45
Life expectancy is 48
Life expectancy is 52
Life expectancy is 57
Life expectancy is 61
Life expectancy is 65
Life expectancy is 68
Life expectancy is 70
Life expectancy is 72
Life expectancy is 74
Life expectancy is 75
Life expectancy is 76
Life expectancy is 77
Life expectancy is 78
Life expectancy is 79
Life expectancy is 80
Life expectancy is 80
Life expectancy is 81
Life expectancy is 82
Life expectancy is 82
Life expectancy is 83
Life expectancy is 84
Life expectancy is 84
Life expectancy is 85
Life expectancy is 86
Life expectancy is 71
Life expectancy is 71
Life expectancy is 72
Life expectancy is 72
Life expectancy is 73
Life expectancy is 73
Life expectancy is 74
Life expectancy is 74
Life expectancy is 75
Life expectancy is 75
Life expectancy is 76
Life expectancy is 76
Life expectancy is 76
Life expectancy is 77
Life expectancy is 77
Life expectancy is 77
Life expectancy is 78
Life expectancy is 78
Life expectancy is 79
Life expectancy is 79
Life expectancy is 80
Life expectancy is 80
Life expectancy is 81
Life expectancy is 82
Life expectancy is 83
Life expectancy is 83
Life expectancy is 84
Life expectancy is 85
Life expectancy is 85
Life expectancy is 86
Life expectancy is 72
Life expectancy is 72
Life expectancy is 73
Life expectancy is 73
Life expectancy is 74
Life expectancy is 74
Life expectancy is 75
Life expectancy is 75
Life expectancy is 76
Life expectancy is 77
Life expectancy is 77
Life expectancy is 78
Life expectancy is 78
Life expectancy is 79
Life expectancy is 79
Life expectancy is 80
Life expectancy is 81
Life expectancy is 81
Life expectancy is 82
Life expectancy is 83
Life expectancy is 83
Life expectancy is 84
Life expectancy is 84
Life expectancy is 85
Life expectancy is 85
Life expectancy is 86
Life expectancy is 86
Life expectancy is 87
Life expectancy is 87
Life expectancy is 88
Total fertility rate
Total fertility rate is 5.96
Total fertility rate is 5.96
Total fertility rate is 5.96
Total fertility rate is 5.96
Total fertility rate is 5.87
Total fertility rate is 5.80
Total fertility rate is 5.62
Total fertility rate is 5.33
Total fertility rate is 4.97
Total fertility rate is 4.41
Total fertility rate is 3.64
Total fertility rate is 2.96
Total fertility rate is 2.32
Total fertility rate is 2.08
Total fertility rate is 1.93
Total fertility rate is 1.83
Total fertility rate is 1.76
Total fertility rate is 1.72
Total fertility rate is 1.69
Total fertility rate is 1.68
Total fertility rate is 1.68
Total fertility rate is 1.69
Total fertility rate is 1.70
Total fertility rate is 1.71
Total fertility rate is 1.72
Total fertility rate is 1.73
Total fertility rate is 1.74
Total fertility rate is 1.75
Total fertility rate is 1.76
Total fertility rate is 1.77
Select year range
Year : 1963
Note: Years 2017 to 2100 are projected data.
i
Source: United Nations, Population Division, World Population Prospects: 2017 Revision
Dashboards available for Nepal
Social Updates
Tweets from UNFPATürkiye