Data Menu
-
Country Pages
-
Asia & the Pacific
- Afghanistan
- Bangladesh
- Bhutan
- Cambodia
- China
- India
- Indonesia
- Iran, Islamic Republic of
- Lao People's Democratic Republic
- Malaysia
- Maldives
- Mongolia
- Myanmar
- Nepal
- Pakistan
- Papua New Guinea
- Philippines
- Sri Lanka
- Thailand
- Timor-Leste
- Viet Nam
-
Eastern Europe & Central Asia
- Albania
- Armenia
- Azerbaijan
- Belarus
- Bosnia and Herzegovina
- Georgia
- Kazakhstan
- Kosovo Office
- Kyrgyzstan
- Moldova, Republic of
- North Macedonia
- Serbia
- Tajikistan
- Türkiye
- Turkmenistan
- Ukraine
- Uzbekistan
-
Arab States
- Algeria
- Djibouti
- Egypt
- Iraq
- Jordan
- Lebanon
- Libya
- Morocco
- Oman
- Palestine
- Somalia
- Sudan
- Syrian Arab Republic
- Tunisia
- Yemen
-
East & Southern Africa
- Angola
- Botswana
- Burundi
- Comoros
- Congo, the Democratic Republic of the
- Eritrea
- Eswatini
- Ethiopia
- Kenya
- Lesotho
- Madagascar
- Malawi
- Mauritius
- Mozambique
- Namibia
- Rwanda
- Seychelles
- South Africa
- South Sudan
- Tanzania, United Republic of
- Uganda
- Zambia
- Zimbabwe
-
Latin America & the Caribbean
- Argentina
- Bolivia, Plurinational State of
- Brazil
- Chile
- Colombia
- Costa Rica
- Cuba
- Dominican Republic
- Ecuador
- El Salvador
- Guatemala
- Haiti
- Honduras
- Mexico
- Nicaragua
- Panama
- Paraguay
- Peru
- Uruguay
- Venezuela, Bolivarian Republic of
- Caribbean (multi-country)
-
West & Central Africa
- Benin
- Burkina Faso
- Cabo Verde
- Cameroon
- Central African Republic
- Chad
- Congo
- Côte d'Ivoire
- Equatorial Guinea
- Gabon
- Gambia
- Ghana
- Guinea
- Guinea-Bissau
- Liberia
- Mali
- Mauritania
- Niger
- Nigeria
- Sao Tome and Principe
- Senegal
- Sierra Leone
- Togo
-
Country Menu
UNFPA North Macedonia
An upper middle-income country in transition, the Republic of North Macedonia has population and development patterns that include an ageing population, decreasing fertility, and migration. UNFPA support began in 2007, focusing on preventing domestic violence, and advocating for sexual and reproductive health and rights, including for youth. Programmes encourage the exchange of expert knowledge and good practices, and help the Government develop strategic policies on population and development issues in line with European Union accession priorities
Data overview
View more
Population
Population, by age group, per cent
 Population aged 0-14
 Population aged 15-64
 Population aged 65+
Sexual and reproductive health
Births attended by skilled health personnel, per cent, 2014-2019
 Births attended by skilled health personnel
Family Planning
Proportion of demand satisfied with modern methods, women aged 15-49, per cent, 2022
 Modern method
Education
Total net enrolment rate, percent
Gender, Rights, and Human Capital
Decision making on sexual and reproductive health and reproductive rights, percent, 2007-2022:
-
Adolescent birth rate per 1,000 girls aged 15-19, 2024:
83
Intimate partner violence, past 12 months, percent, 2018:
8
Decision making on women's own health care, percent, 2007-2022:
-
Decision making on contraceptive use, percent, 2007-2022:
-
Decision making on sexual intercourse, percent, 2007-2022:
-
Harmful Practices
Child marriage by age 18, percent, 2023:
33
Female genital mutilation prevalence among girls aged 15-19, percent, 2022:
-
Demographic Dividend: North Macedonia
View more
Population Pyramid
Year: 1950
females
males
Population in thousands
Life Expectancy
Life expectancy is 37
Life expectancy is 40
Life expectancy is 43
Life expectancy is 46
Life expectancy is 49
Life expectancy is 52
Life expectancy is 54
Life expectancy is 56
Life expectancy is 58
Life expectancy is 60
Life expectancy is 62
Life expectancy is 64
Life expectancy is 66
Life expectancy is 67
Life expectancy is 68
Life expectancy is 69
Life expectancy is 70
Life expectancy is 70
Life expectancy is 71
Life expectancy is 72
Life expectancy is 72
Life expectancy is 73
Life expectancy is 74
Life expectancy is 74
Life expectancy is 75
Life expectancy is 76
Life expectancy is 77
Life expectancy is 78
Life expectancy is 78
Life expectancy is 79
Life expectancy is 36
Life expectancy is 38
Life expectancy is 41
Life expectancy is 45
Life expectancy is 48
Life expectancy is 52
Life expectancy is 55
Life expectancy is 56
Life expectancy is 59
Life expectancy is 62
Life expectancy is 64
Life expectancy is 66
Life expectancy is 69
Life expectancy is 70
Life expectancy is 71
Life expectancy is 72
Life expectancy is 73
Life expectancy is 74
Life expectancy is 75
Life expectancy is 76
Life expectancy is 77
Life expectancy is 78
Life expectancy is 78
Life expectancy is 79
Life expectancy is 80
Life expectancy is 80
Life expectancy is 81
Life expectancy is 81
Life expectancy is 82
Life expectancy is 83
Life expectancy is 72
Life expectancy is 72
Life expectancy is 73
Life expectancy is 73
Life expectancy is 74
Life expectancy is 74
Life expectancy is 74
Life expectancy is 74
Life expectancy is 75
Life expectancy is 75
Life expectancy is 76
Life expectancy is 76
Life expectancy is 77
Life expectancy is 77
Life expectancy is 77
Life expectancy is 78
Life expectancy is 78
Life expectancy is 78
Life expectancy is 78
Life expectancy is 79
Life expectancy is 79
Life expectancy is 79
Life expectancy is 80
Life expectancy is 80
Life expectancy is 80
Life expectancy is 81
Life expectancy is 81
Life expectancy is 82
Life expectancy is 82
Life expectancy is 83
Life expectancy is 72
Life expectancy is 73
Life expectancy is 73
Life expectancy is 74
Life expectancy is 75
Life expectancy is 75
Life expectancy is 75
Life expectancy is 75
Life expectancy is 76
Life expectancy is 77
Life expectancy is 77
Life expectancy is 78
Life expectancy is 78
Life expectancy is 79
Life expectancy is 79
Life expectancy is 80
Life expectancy is 80
Life expectancy is 80
Life expectancy is 81
Life expectancy is 81
Life expectancy is 82
Life expectancy is 82
Life expectancy is 82
Life expectancy is 83
Life expectancy is 83
Life expectancy is 84
Life expectancy is 84
Life expectancy is 85
Life expectancy is 85
Life expectancy is 86
Total fertility rate
Total fertility rate is 5.40
Total fertility rate is 6.16
Total fertility rate is 6.42
Total fertility rate is 6.46
Total fertility rate is 6.33
Total fertility rate is 5.50
Total fertility rate is 4.60
Total fertility rate is 3.85
Total fertility rate is 3.23
Total fertility rate is 2.25
Total fertility rate is 1.92
Total fertility rate is 1.93
Total fertility rate is 1.96
Total fertility rate is 1.95
Total fertility rate is 1.93
Total fertility rate is 1.92
Total fertility rate is 1.92
Total fertility rate is 1.91
Total fertility rate is 1.91
Total fertility rate is 1.90
Total fertility rate is 1.90
Total fertility rate is 1.90
Total fertility rate is 1.90
Total fertility rate is 1.90
Total fertility rate is 1.90
Total fertility rate is 1.89
Total fertility rate is 1.89
Total fertility rate is 1.89
Total fertility rate is 1.89
Total fertility rate is 1.89
Select year range
Year : 1952
Note: Years 2017 to 2100 are projected data.
i
Source: United Nations, Population Division, World Population Prospects: 2017 Revision
Dashboards available for North Macedonia
News

News
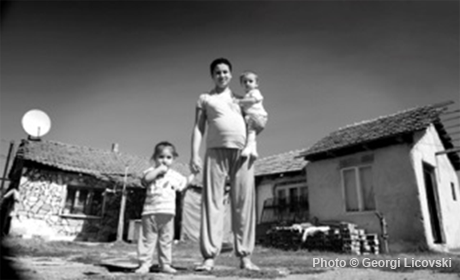
Addressing Low Fertility in a World of 7 Billion: Macedonians Try Financial Incentives
VEVCHANI, The former Yugoslav Republic of Macedonia — This mountain village of tiled roofs and narrow streets dates…